Heating & Cooling Curves
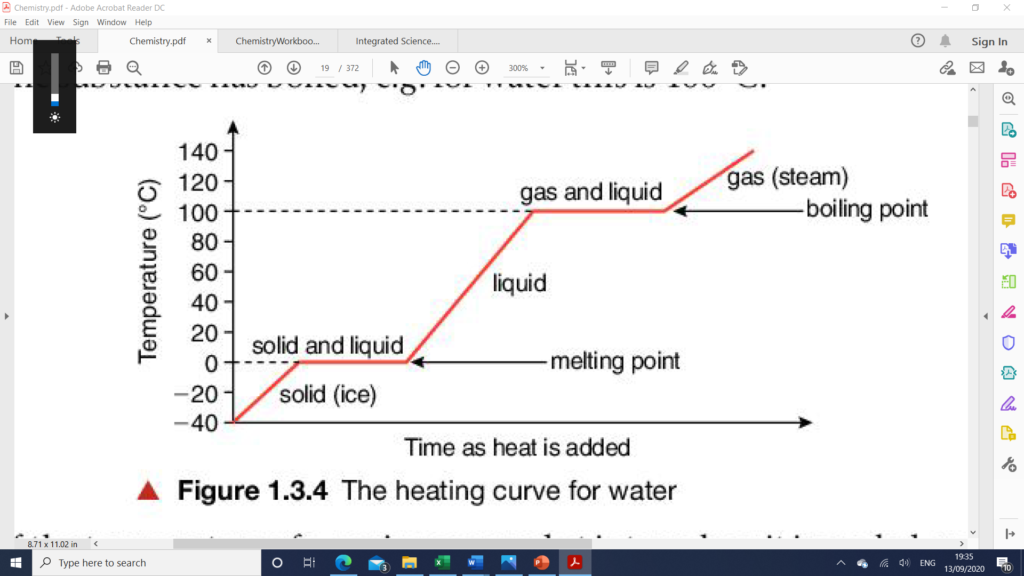
Heating Curve
When a pure solid is heated and its temperature is measured at intervals as it converts from a solid to a liquid then to a gas and plotted on a graph against time a heating curve is formed.

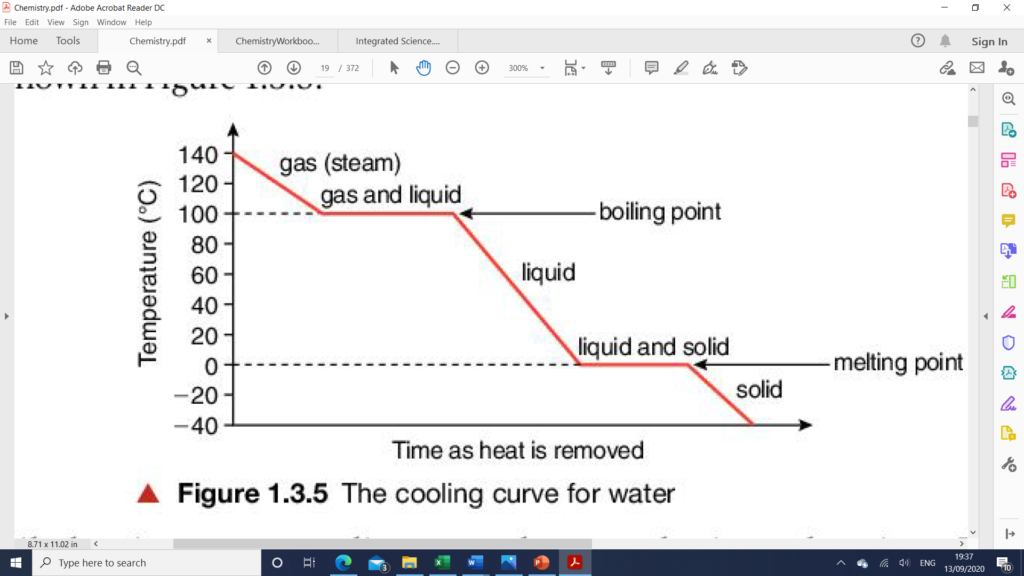
Cooling Curve
If the temperature of gas is observed and measured at intervals as it cools and changes its state to a liquid then to a solid and the temperature is plotted on a graph against time, a cooling curve is obtained.

Lesson Content
