
Solubility Curves
Solubility Curves
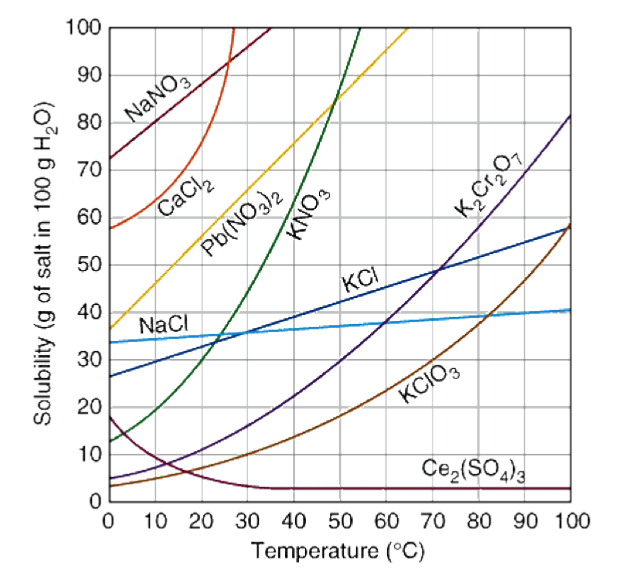
A solubility curve is a data based graph comparing the amount of solute that will dissolve in a given amount of solvent at various temperatures.
The most typical solubility curves are graphed based solid and gaseous solutes dissolved in 100 grams of water.
The solubility of most solids increases when there is an increase in temperature. This means as the temperature increases, a greater mass of solute is needed to saturate a fixed mass of water.
Interpretation of Data
A solution is considered, unsaturated if the concentration (C) is less than the solubility (S).
A solution is considered saturated if the concentration (C) is the same as the solutbility (S).
A solution is considered supersaturated if the concentration (C) is more that the solubility (S).
Data Collected from a Solubility Curve
- The solubility of a solid at any given temperature within the range of the graph.
- The temperature at which crystals start to form if an unsaturated solution is cooled to the point where it is just saturated.
- The mass of solid that would crystallize out of a saturated solution if its temperature is decreased.
- The mass is solid to be added to re-saturated solution if its temperature is increased.
- The minimum mass of water required to dissolve a fixed mass of solute at a given temperature.
Solubility of Gases
Gases are more soluble at lower temperatures.
When a solvent with a gas dissolved in it is heated, the kinetic energy of both the solvent and solute increases. As the kinetic energy of the gaseous solute increases, its molecules have a greater tendency to escape the attraction of the solvent molecules and return to the gas phase. Therefore, the solubility of a gas decreases as the temperature increases.
Solute(g) + water(l) = saturated solution(aq) + heat